What Color Is Sunlight?
At the end of our last article, Your Eyes Only Count to Three: How Do We See Color?, the “for the curious” section says: “All signals here are scaled so that daylight (CIE D65) gives 1.” In other words, when computing colors, we have been using daylight as the reference all along. Before that, in Why Do Autumn Leaves Turn Yellow and Red, Little by Little?, every color was computed under daylight too.
Daylight has been our ruler for measuring color. But what color is the ruler itself?
Kids often draw the Sun yellow, or red. Astronauts, though, say that from space the Sun looks white. Who’s right?
Take a guess
Many people would say: the Sun is yellow, of course. That’s how it looks in textbooks and pictures.
Others have looked it up: sunlight’s spectrum is strongest around 500 nm, right between blue and green. So shouldn’t the Sun be blue-green?
Neither is right. To find out why, let’s first look at what’s actually in sunlight.
What’s in sunlight
Scientists have measured how strong sunlight is at each wavelength, both above the atmosphere and on the ground:
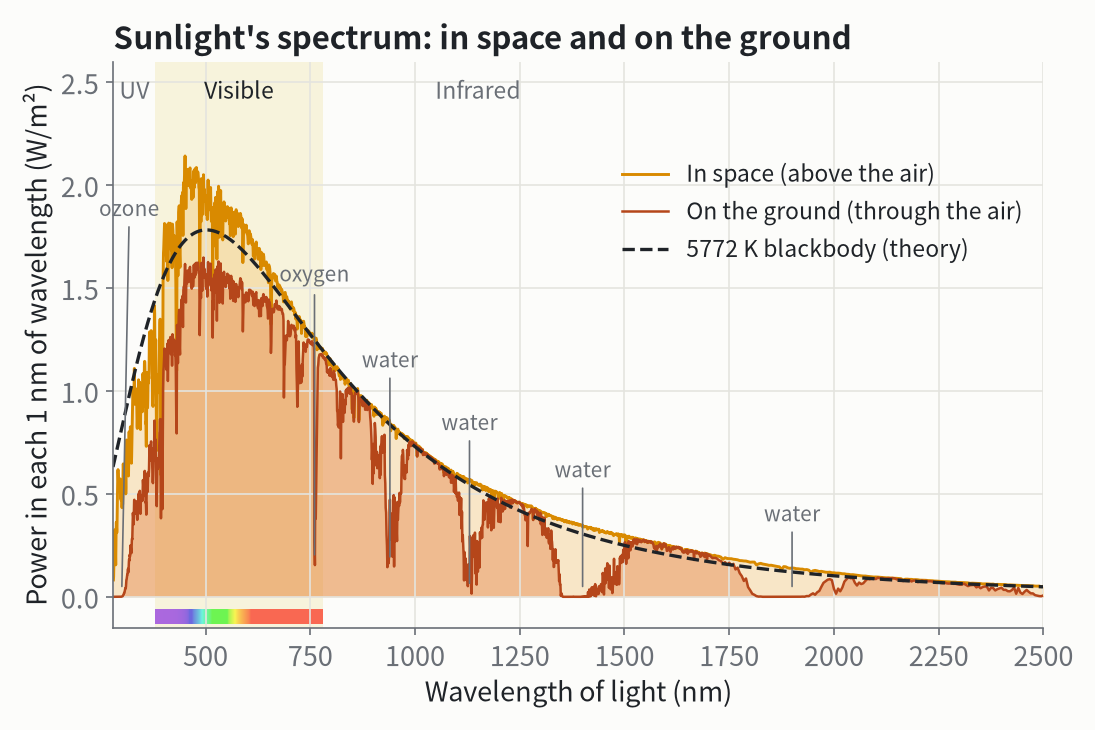
First, how to read this chart. The vertical axis, “power in each 1 nm of wavelength,” means: slice sunlight by wavelength into strips 1 nm wide, and ask how many watts each strip delivers to one square meter. For example, the strip of light from 500 to 501 nm delivers about 1.9 watts per square meter. Add up all the strips and you get the total power of sunlight: above the atmosphere, each square meter facing the Sun receives about 1360 watts; on a clear day with the Sun high in the sky, about 1000 watts still reach the ground, and the ground curve in the chart is computed for just such standard conditions. The actual value on the ground changes with the Sun’s height, the weather and the season.
First finding: sunlight’s spectrum is very wide. The light we can see is only about half of its energy (49%); another 45% is invisible infrared, and the rest is ultraviolet.
Second: the curve hugs a theoretical curve very closely, the dashed line. That line comes from a formula for how hot things glow, which we’ll get to shortly.
Third: after passing through the atmosphere, the spectrum has gaps bitten out of it. Ozone eats the shortest-wavelength part of the ultraviolet, and oxygen and water vapor take several big bites out of the infrared. These are fingerprints our atmosphere leaves on sunlight.
Why isn’t the Sun blue-green?
Now we can use the method from the last article and simply compute the three numbers the eye receives.
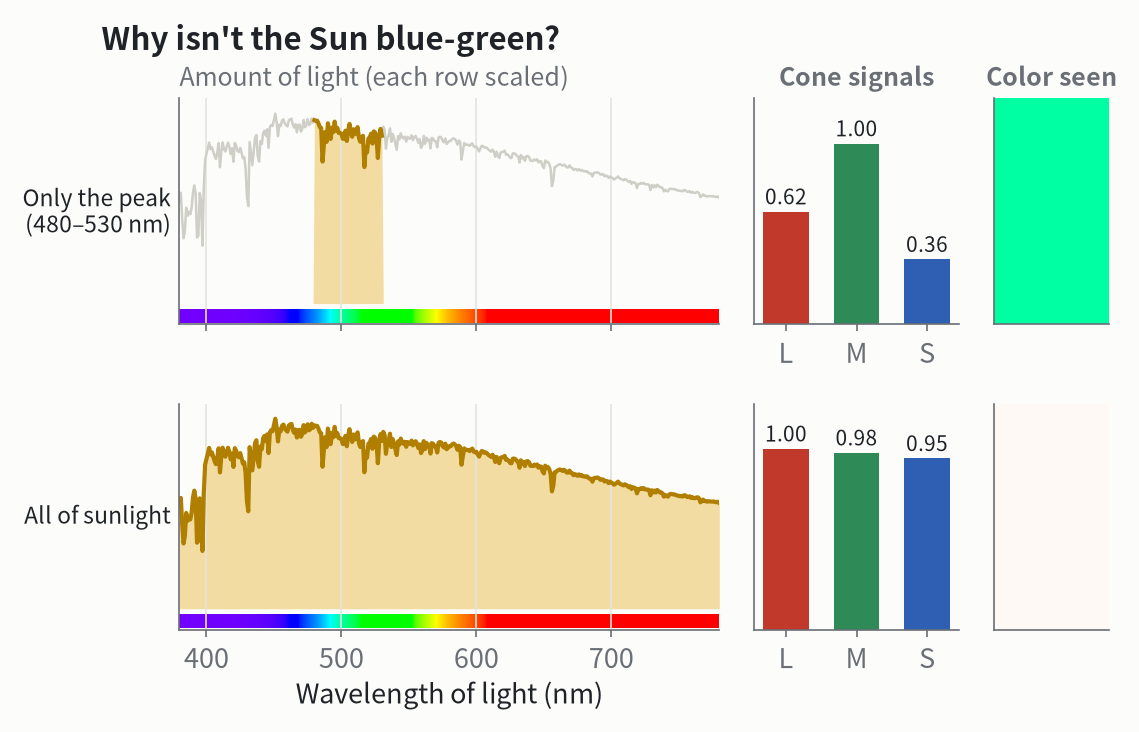
If we keep only that narrow band around the peak, the three cone signals are 0.62 : 1 : 0.36. The M cones are the most excited, and it really does look blue-green.
But sunlight isn’t just its peak. Its spectrum is wide and gentle, stretching from violet all the way to red, so all three kinds of cones get about the same share: the signals are 1 : 0.98 : 0.95, almost exactly equal. When the three numbers match, the brain reads white.
So where the spectrum peaks doesn’t decide the color. Color depends on the balance of the three numbers, and sunlight makes them almost the same.
The Sun’s color comes from its temperature
Where does that dashed line come from?
Anything hot gives off light. A stove coil glows red when it’s hot, embers glow orange, and the tungsten filament in an old light bulb glows yellow-white. In 1900 the physicist Max Planck found a formula for how much light an object at temperature T gives off at each wavelength.
Heat something up from 1000 K to 12000 K and watch how its spectrum and color change:
The hotter it gets, the more the peak of the spectrum slides toward short wavelengths, and the color goes from dull red to orange, yellow, white and finally blue-white. At the same time, the same patch of surface gives off far more light, in proportion to the temperature to the fourth power: double the temperature, and it gives off 16 times as much. The number under the color patch compares each square meter of surface: a sheet of iron at 1000 K gives off only about 0.09% as much as a square meter of the Sun’s surface, while a star’s surface at 12000 K gives off 19 times as much.
The Sun’s surface is about 5772 K, roughly 5500 degrees Celsius (about 9900 °F). At that temperature the peak lands inside the visible range, and the whole curve covers visible light from violet to red. That’s why the Sun is white.
Isn’t the center of the Sun hotter?
Yes. The center of the Sun is about 15 million degrees, and that’s where nuclear fusion makes its energy. But that energy takes a long time to reach the surface. Through most of the Sun’s interior, light travels only a short way before it is absorbed and given off again in some random direction, so the energy inches outward; this is estimated to take somewhere between ten thousand and more than a hundred thousand years. In the outermost third or so, churning currents of hot gas (convection) carry the energy up instead. Along the way, the energy is handed to cooler and cooler outer layers.
The sunlight we see comes from a layer at the surface called the photosphere. Below it, light keeps getting blocked; at this layer, light can finally fly straight out into space. So sunlight’s spectrum reflects the temperature of the photosphere, not of the center. Once it leaves the photosphere, the light travels almost unhindered and reaches Earth in about 8 minutes and 20 seconds. The spectrum measured above our atmosphere is essentially what left the Sun, until the air bites out the gaps in the first chart.
The photosphere itself doesn’t have just one temperature; it gets hotter the deeper you go. That’s why the real solar spectrum differs a little from the ideal dashed curve.
Put glowing things side by side on one color strip:
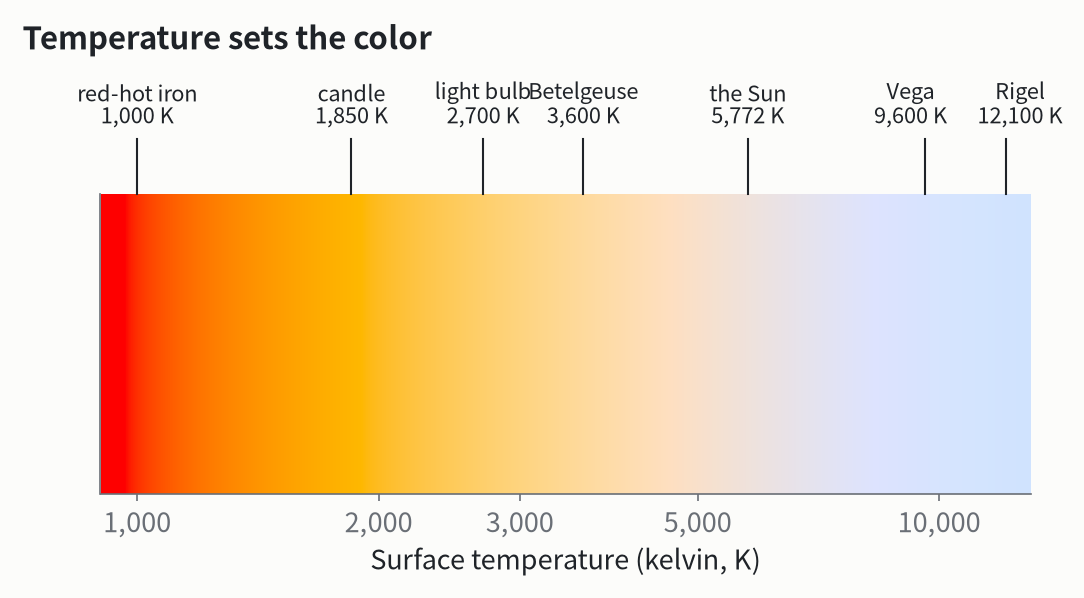
This explains something fun: there are no green stars. A hot object’s spectrum is always wide. When its peak sits near green, it also covers plenty of red and blue, so it looks white.
So why do we think the Sun is yellow?
One reason is that as sunlight passes through the air, some of its blue light gets bounced off in every direction. A little less blue is left in the direct beam, so the Sun looks slightly yellow. The lower the Sun sits, the more air its light crosses, the more blue gets bounced away, and the more yellow and red the Sun looks. The blue light that gets bounced away is spread across the whole sky.
Another reason has to do with our eyes. In its “what we still don’t know” section, the last article raised a question: a sheet of white paper sends very different spectra into the eye at noon and under a light bulb, yet we see it as white both times. This is called color constancy. Now we can compute it and see:
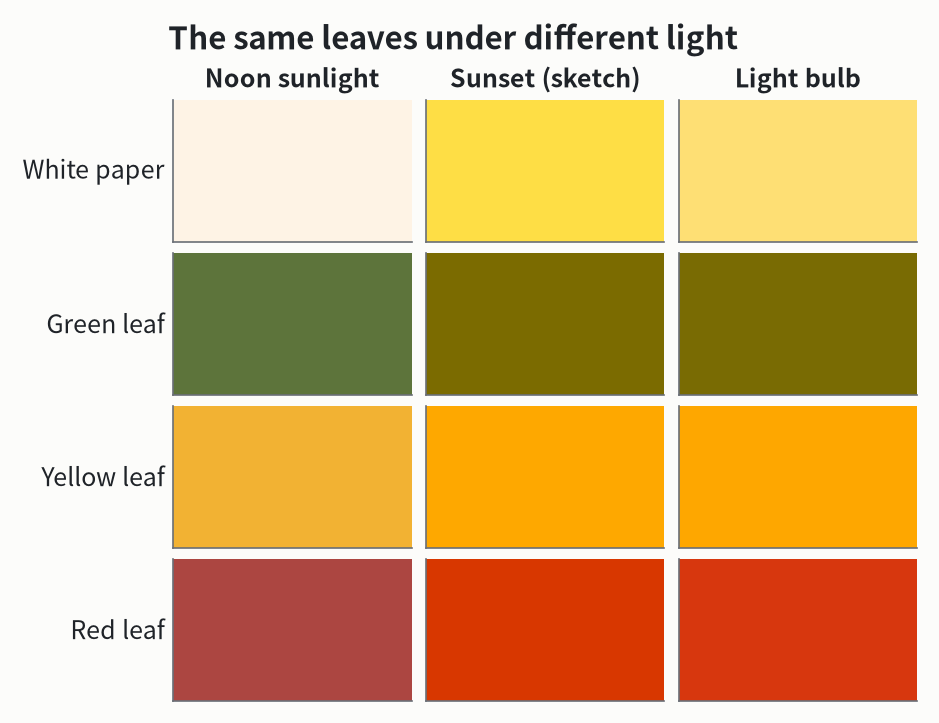
Under sunset light and a light bulb, the white paper turns clearly yellow and the green leaf turns olive. That’s how a camera sees it, which is why photos taken under lamps often look yellow. Yet when we stand under the lamp, the paper still looks white to us. How the brain does this isn’t fully understood, but it makes it hard for us to notice that evening light and lamplight are really yellowish.
In one sentence: sunlight is white. Its spectrum is wide and even, exciting the three kinds of cones about equally, and the shape of that spectrum comes from the Sun’s surface temperature of about 5500 °C.
How do we know?
- Look up at the stars. On a winter evening, find Orion. Betelgeuse at its upper left is orange-red; Rigel at its lower right is blue-white. With no instruments at all, you can see that one is cooler and the other hotter.
- Dark lines in sunlight. In 1814, Joseph von Fraunhofer looked closely at sunlight through a prism and saw hundreds of dark lines in the rainbow. Later, people realized that each element absorbs light of particular wavelengths, so these lines are signatures of the elements in the Sun’s outer atmosphere. In 1868, astronomers found a yellow line in the solar spectrum that matched nothing known, and named the new element helium, after the Greek word for the Sun. It wasn’t found on Earth until 1895.
- Measuring from space. Satellites measure sunlight above the atmosphere continuously, and there are many ground stations too. The two spectra in the first chart are the standard solar spectra (ASTM G173) published by the U.S. National Renewable Energy Laboratory and others, computed with an atmospheric radiation model under standard conditions and checked against those measurements.
What we still don’t know
- Why is the Sun’s outer layer hotter than its surface? The Sun’s surface is about 5500 °C, yet the thin corona around it reaches one or two million degrees. How does heat flow “uphill”? This “coronal heating problem” is still unsolved and one of the most famous puzzles in solar physics.
- Did our eyes adapt to sunlight? The wavelength our eyes are most sensitive to is close to where sunlight is strongest, which looks like the result of evolution. But as the “for the curious” section explains, where a spectrum peaks depends on how you count. So what this “coincidence” really tells us is subtler than it seems.
Next time you watch a sunset, remember: the light leaving the Sun is white the whole time; it’s the thick air that paints it orange and red.
For the curious: the formula, the data, and a trap about “the peak”
Planck’s law. The radiation a blackbody at temperature T gives off per unit wavelength is
B(λ, T) = 2hc² / λ⁵ · 1 / (e^(hc/λkT) − 1),
where h is Planck’s constant, c the speed of light and k Boltzmann’s constant. Two rules follow: the peak wavelength is λ_peak ≈ 2.898 mm·K / T (Wien’s displacement law), and the total radiation per unit area grows as T⁴ (the Stefan–Boltzmann law). The dashed line in the first chart is a blackbody with the Sun’s radius and a temperature of 5772 K, as seen from Earth’s distance, with no fitting at all.
Where “the peak” is depends on how you count. To draw a spectrum, you first sort the light into bins and then count how much light lands in each bin. The first chart uses bins of “1 nm of wavelength”; you could instead use bins of “1 THz of frequency.” These bins aren’t the same width: a 1 THz step in frequency covers only 0.53 nm of wavelength near 400 nm, but 3.34 nm near 1000 nm. With frequency bins, the bins on the long-wavelength side are “wider,” hold more light, and the peak shifts toward long wavelengths.
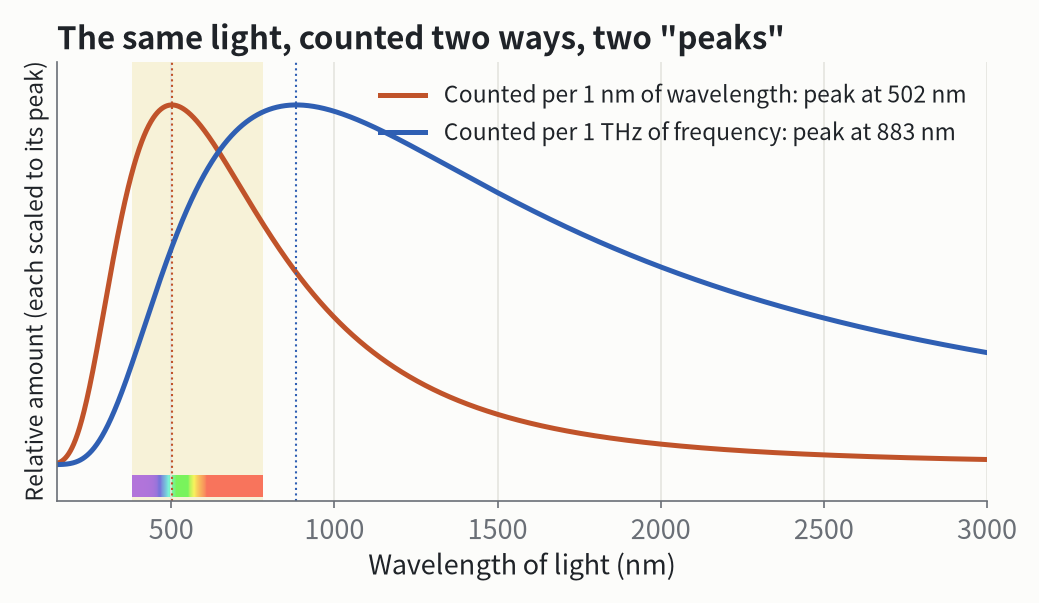
The light itself hasn’t changed at all; only the way of counting it has. So a statement like “sunlight has the most green light” depends on the bins you count with and isn’t a physical fact independent of how you count. What doesn’t depend on the counting is the three numbers the eye receives.
Data and calculation. Solar spectra: ASTM G173-03 reference spectra (above the atmosphere, and global irradiance on the ground at air mass 1.5), published by the U.S. National Renewable Energy Laboratory; the 49% and 45% are computed over 280 to 4000 nm. Solar effective temperature 5772 K: the International Astronomical Union’s 2015 nominal value. Cone signals use the same method and data as the last article (Stockman & Sharpe 2000). Color patches in the strip and the animation show only hue at a fixed brightness. Sunlight above the atmosphere is slightly warmer than a screen’s standard white (D65), so its patch in the second chart has a faint warm tint.
Sunset and light bulb. The sunset light is a sketch: sunlight from above the atmosphere, multiplied by the transmission through about 12 air masses of Rayleigh scattering plus a little haze (the Sun about 4 degrees above the horizon), ignoring absorption by ozone and other gases. The light bulb is a 2700 K blackbody. All three lights are exposed so the white paper has the same brightness, with the white balance fixed to daylight.